Varroa sensitive hygiene is a trait, not a breed. That single sentence decides how a breeding programme is budgeted, because a trait has to be measured on every candidate colony before it can be selected on, and the measurement is the expensive part. Buying a queen labelled VSH is one transaction. Running a selection programme is a recurring labour commitment that has to survive several seasons before it shows up in mite counts.
This article is written for operations and distributors who are weighing the second option, and for buyers who want to know what questions to put to a queen breeder before paying a premium. It covers what the trait is in numbers, which assays produce those numbers, what mating control costs in equipment and labour, and what a realistic calendar looks like in either hemisphere. Every figure quoted here is attributed to a named source and year.
What varroa sensitive hygiene measures, and the numbers behind it
VSH describes worker bees detecting pupae infested with reproducing mites, uncapping those cells and removing the pupa and the mite. The consequence is a brood population with a high share of mites that fail to reproduce. The line was developed at the USDA Honey Bee Breeding, Genetics and Physiology Laboratory in Baton Rouge; it was called suppressed mite reproduction (SMR) until 2005, when the USDA group concluded that the infertility they were seeing was linked to hygienic removal of infested pupae, and renamed the programme Varroa Sensitive Hygiene.
Harbo and Harris, Journal of Apicultural Research 44(1):21–23, 2005, gave the mechanism its numbers. Nine SMR colonies and eight controls each received a comb of newly capped worker brood that was naturally infested with varroa. After eight days, SMR colonies averaged 2.2% of cells infested against 9.0% in controls. Of the mites that remained, SMR colonies showed 80% non-reproductive mites against 29%. When only mites with no progeny were counted, the two groups were almost identical at 1.2 and 1.3 mites per 100 cells of brood. The reading is that these bees remove reproductive mites rather than make mites infertile.
A USDA trial reported by Villa and co-workers added a brood-side effect: mites reared in brood from SMR-derived colonies in 2007 had significantly lower fecundity than mites in brood from unselected stock, 1.49 against 2.96 progeny per foundress, driven mainly by lower fertility (63% against 94%) and delayed oviposition. The same paper is useful for a second reason. Bidirectional selection on that brood effect diverged in the first two generations and then stopped: from 2010 onward high and low lines did not differ significantly, and they were still similar in 2013 and 2014. Selection on this trait stalled, which is a fair warning about how much a programme can promise.
Expression varies widely between colonies. Tsuruda and colleagues, working from the USDA Baton Rouge selection programme, described a high-VSH queen whose colony removed 85–95% of mite-infested pupae in a one-week assay, against a low-VSH colony that removed no more than 15%. Fifteen daughter queens from the high line, each instrumentally inseminated with a single drone from the low parent, produced colonies averaging 40.6% removal; the best reached 62%. Backcrossing to a single high-VSH drone brought the mean to 59.0%, with the top colony at 83%.
The assays are the cost centre
Three measurements appear repeatedly in the literature, and each one carries its own labour load. Choosing between them is a budget decision before it is a genetic one.
| Assay | What is counted | Common pass level | Practical note |
|---|---|---|---|
| VSH brood assay (infested-comb transfer) | Reduction in mite infestation in a comb of mite-infested capped brood after about one week | Removal of 80% or more of mite-infested brood after 1 week (Danka et al., 2016) | Needs a source comb with known infestation; more replication is required when colonies have low resistance |
| Non-reproductive mite frequency | Share of foundress mites in capped cells that produced no viable offspring | 60% or more non-reproductive mites (Danka et al., 2016) | Requires opening cells and classifying each mite family; slow and needs trained scorers |
| Mite population growth | Change in mite population over a reproductive cycle | Growth of 1.0 or less per reproductive cycle (Danka et al., 2016) | The original selection method; takes weeks of colony monitoring |
| Freeze-killed brood assay | Share of freeze-killed sealed brood removed, usually at 24 hours | 95% or more removal within 24 hours | Fast and cheap, but selects general hygienic behaviour; on its own it does not deliver VSH-level resistance |
The 2016 benchmark set from Danka and colleagues is the most useful thing to hold a breeder to: a colony that genuinely needs no varroa treatment tends to show mite population growth of 1.0 or less per reproductive cycle, at least 60% non-reproductive mites, and removal of at least 80% of mite-infested brood within a week. Colonies meeting all three are rare, which is why the screening funnel has to start with many candidates.
The freeze-killed brood assay deserves a warning. It is the standard test for general hygienic behaviour, developed through the Minnesota hygienic line, and it takes a fraction of the labour of the VSH assay. It is also, on current evidence, not sufficient on its own: programmes that select only on freeze-killed brood do not reliably reach the resistance levels produced by the more laborious mite-based methods. Use it to screen out the worst colonies cheaply, then spend the expensive assay on what survives.
Alcohol wash counts belong in the same record set even though they are not a resistance test. The commonly used sample is about 300 bees taken from the brood nest, and the count is expressed as mites per 100 bees. Mite load is the outcome the breeding programme is trying to move; the behavioural assays are the mechanism. Tracking both is what tells you whether the mechanism is working.
Mating control is the line item nobody budgets
A queen mates with many drones. Published work on mating frequency puts the figure at roughly 12 to 20 drones per mating flight, which means a colony’s worker force is genetically diverse and the drones in the surrounding area contribute half the genetics of every colony the programme raises. One generation of open mating around unselected drones dilutes a selected queen line immediately.
There are three ways to control it, in ascending order of cost and control. Drone flooding means saturating a mating area with drones from selected colonies, which raises the odds without guaranteeing them. Isolated mating yards remove outside drones by geography. Instrumental insemination with semen from known drone mothers gives full control of the paternal side, and is how the USDA programme produced the single-drone crosses used in the genetic work.
The USDA ARS project on VSH-based mite resistance (project 6050-21000-016-001-S, running 2016 to 2021) gives a sense of scale at the research end: create 100 colonies headed by single-drone inseminated queens from the best available genetic sources, infest them with mites, measure the rate of varroa reproduction, then establish an isolated mating apiary with 200 drone colonies drawn from the selected high-VSH breeders, and keep culling and replacing underperforming queens. That is a research programme, and a commercial one can run leaner, but the shape is the same: breeder colonies, drone-source colonies, mating control, and a culling decision every season.
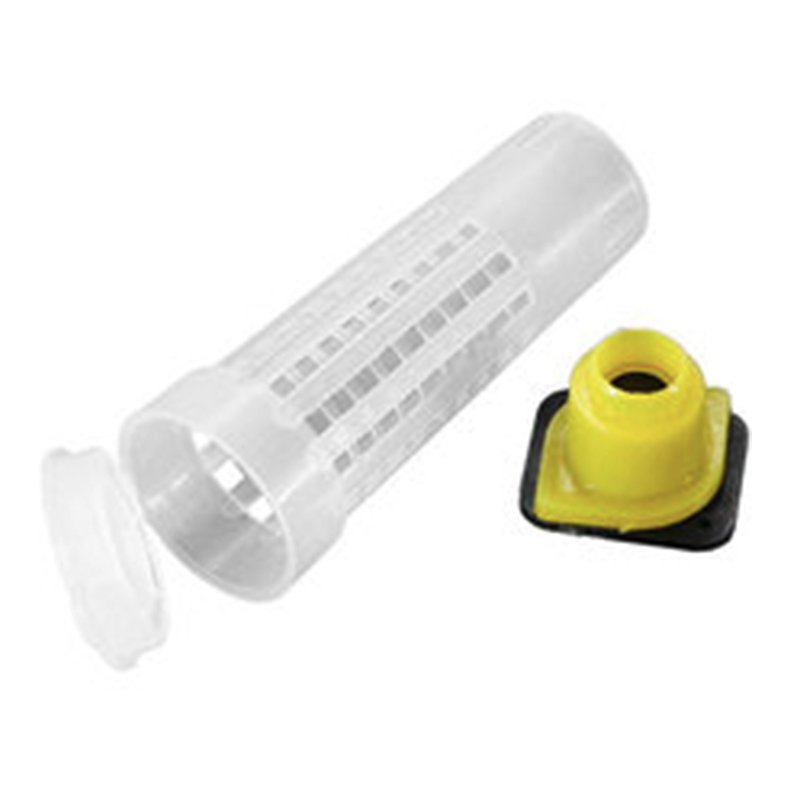
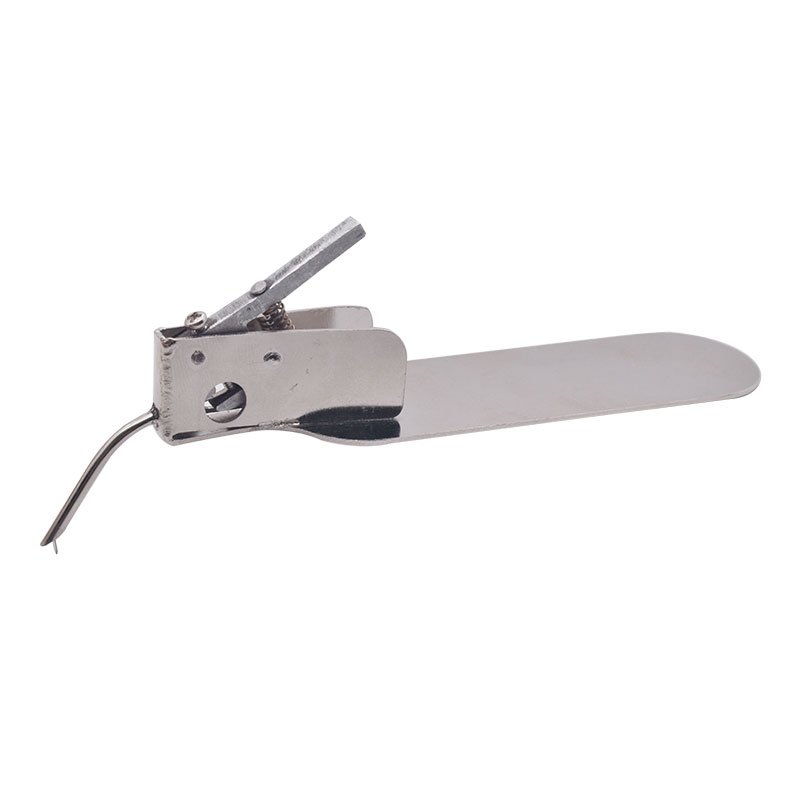
Equipment follows the method. Instrumental insemination needs a device, a supply of semen and an operator who has been trained on it — see the bee breeding artificial insemination device for the category we supply into. Grafting-based rearing needs good tools and cell cups; a German grafting tool with a dual-function tip and a consistent supply of cell cups are the two items that wear out or run short in a rearing season. The rest of the mating-nucleus hardware sits in the queen rearing and queen cage category, and silicone queen cell cup moulds let a programme make its own cups rather than buying them each season.
What the losses look like if nothing is selected
The economic case for a breeding programme rests on the loss figures. Preliminary results from the 2024–2025 US Beekeeping Survey, led by Auburn University and the Apiary Inspectors of America as a continuation of the long-running Bee Informed Partnership work, put winter colony losses at 40.2% between 1 October 2024 and 1 April 2025 — the highest recorded since tracking began in 2007, against a 17-year winter average of 29.3%. Annual loss figures quoted for the same season vary by source between 55.1% and 55.6%, and the survey organisers describe the results as preliminary.
Varroa is identified as the leading driver of that mortality, both through direct feeding damage and through the viruses the mite vectors. For a commercial operation the arithmetic is simple enough: a colony that dies has to be replaced with a split or a package, and a replacement costs money and a season of production.
That is the honest framing for resistance genetics. They reduce the frequency and severity of treatment and they improve survival; they do not remove the need to monitor. The Honey Bee Health Coalition treats genetic resistance as one tool among several rather than a replacement for monitoring, and the national beekeeping survey results are the reference for what losses actually run at. UK and EU buyers can cross-check against the National Bee Unit, and the underlying bee breeding work is published by USDA Agricultural Research Service, including the project page for breeding varroa-resistant stock.
A queen breeding calendar that works in both hemispheres
Selection runs on the colony’s annual cycle, so the calendar shifts by six months between hemispheres. The sequence inside each window is the same: screen, select, raise, mate, evaluate, cull.
| Stage | Northern hemisphere (North America, Europe) | Southern hemisphere (Australia, New Zealand, Chile, South Africa) |
|---|---|---|
| Drone-source colonies built up | March to April, ahead of virgin flights | September to October |
| Screening and VSH assays | April to June | October to December |
| Grafting and cell raising | May to July | November to January |
| Mating window | June to August | December to February |
| Mite-load evaluation of daughter colonies | August to September | February to March |
| Cull and re-select | September to October | March to April |
Two rules make the calendar work. Build drone-source colonies two to three weeks before the virgins are due to fly, because drone numbers lag the rest of the season. And give a new queen at least six weeks of laying before scoring nurse-driven behaviour, since a colony’s hygiene score is partly a function of the workers currently in it rather than the queen alone.
Southern-hemisphere programmes have one structural advantage and one disadvantage. The advantage is a long build-up: the spring flow runs from September and supports a sustained grafting season. The disadvantage is that mating windows compress over the Christmas and New Year period precisely when labour is hardest to hold, so the grafting and mating schedule has to be planned around staffing rather than around the bees.
What a season of selection costs
There is no published standard cost for running a VSH programme, and the numbers below are indicative inputs rather than a budget. They are the line items that recur in the descriptions of commercial programmes, and the correct way to use them is to price them against local labour rates.
| Input | Unit | Indicative figure | Source and caveat |
|---|---|---|---|
| Breeder colonies carried for screening | Colonies per cycle | 25 or more breeder queens is the diversity floor quoted in extension guidance | Guidance figure; scale it to how much culling pressure you intend to apply |
| Assay labour | Hours per colony per assay | Varies by method and operator skill — ask a breeder running the same assay for their timing | No standard figure published; the VSH assay and non-reproductive-mite counts are the slow ones |
| Instrumental insemination | Per queen | Equipment plus consumables plus a trained operator | Cost varies by device model and throughput — ask the supplier for a measured specification |
| Purchased queens, standard stock | USD per queen | Roughly 30 to 50 in 2024 | US retail range reported by an industry guide (VarroaVault, 2024); varies by country, volume and season |
| Purchased queens, documented VSH or hygienic selection | USD per queen | Roughly 40 to 80; pedigree-verified or instrumentally inseminated queens reported up to 100 to 150 | Same source and caveat; treat as indicative, not as a quotation |
| Mating nuclei | Units per breeder queen | Several nucs per candidate, because daughter colonies must be tested | Scale with the number of candidates carried through the funnel |
| Years to visible change | Seasons | Three to five before population-level change is measurable | Commonly quoted expectation in breeding guidance; not a measured trial result |
The cheapest way to run this is to buy documented genetics and use local drone pressure to hold them, accepting dilution. The most expensive is full instrumental insemination across a closed programme. Most commercial operations sit in between: buy VSH-derived breeders, raise daughters, flood drones from the best colonies, and cull on mite counts taken at the same point every year.
Checks before paying a premium for VSH genetics
The summary below is what to ask for, and what to do with the answers.
Ask which assay produced the score. A freeze-killed brood result of 95% is a hygiene score, not a VSH score. Ask whether the breeder runs an infested-comb transfer or counts non-reproductive mites, and what the numbers were.
Ask for the colony-level benchmarks. A programme that can quote mite population growth per reproductive cycle, the share of non-reproductive mites, and the percentage of mite-infested brood removed in a week is working to the 2016 Danka criteria. One that quotes only a percentage is probably quoting something else.
Ask where the queens were mated. Isolated yard, drone-flooded yard, or open-mated. Open-mated daughters of a VSH breeder will not hold the trait, because queens mate with roughly 12 to 20 drones and the local drone population supplies half the genetics.
Ask for mite counts with dates and method. Mites per 100 bees from a 300-bee alcohol wash, taken at the same point in the season, year on year. Trend data is the only thing that distinguishes a programme working from one that is drifting.
Do not drop monitoring. Resistant genetics cut treatment frequency; they do not remove the need to count mites. Programmes that stopped monitoring because they had resistant stock tend to find out in the second or third year.
Expect a lag, and budget for it. Three to five seasons is the commonly quoted horizon before population-level change shows up, and the USDA’s own attempt to select a brood-based effect stalled after two generations of divergence. A programme that promises faster than that is promising something the published record does not support.
The equipment side of this is the part we can quote on directly: insemination devices, grafting tools, cell cups and mating nucleus hardware, ordered to land ahead of the grafting window for your hemisphere. The genetics side is not ours to sell, and the honest advice is to buy it from a breeder who will show you the assay results rather than the brand name.