
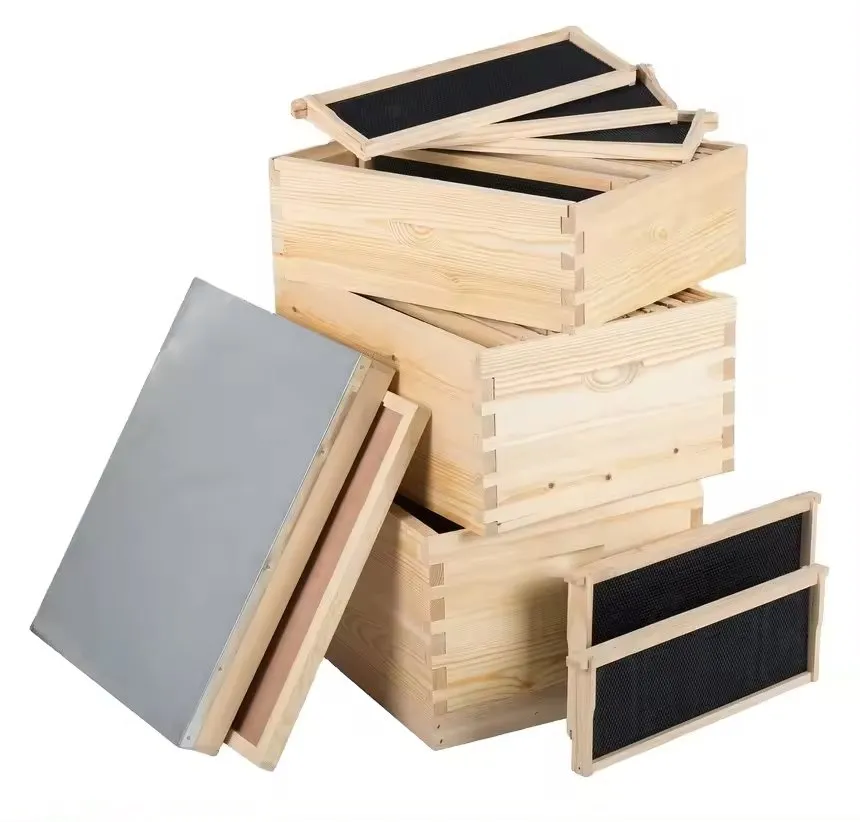
An insulated plastic hive and a timber hive can sit in the same apiary all winter and come out of March with different amounts of honey left in them, different mortality and different repair bills in April. That is the part of the insulated plastic hive vs timber thermal comparison worth pricing. Everything else — brand preference, habit, what the neighbouring operation runs — counts for less than three things: how fast heat leaves the box, how much heat the wall itself can store, and where the water vapour ends up going.
This is written from the factory side. We build both types, so there is no advantage for us in pretending either one wins everywhere. What follows separates what can be traced to published data from what depends on the specific mould, foam density or board thickness. Where a number cannot be sourced, we say so and name the report you should ask for — from us or from anyone else quoting you.
What actually changes when the wall changes
A hive wall is a heat resistor. Heat flows from the warm inside to the cold outside at a rate set by the temperature difference and by how much resistance sits between the two. The material property behind that is thermal conductivity, written k and measured in watts per metre-kelvin, W/(m·K). Lower k means slower heat flow. The wall property most people quote is R, thermal resistance, and for a flat layer it is simply thickness divided by conductivity.
That one relationship explains most of the difference between the two box types. Pine conducts heat at roughly 0.12 W/(m·K) while expanded polystyrene sits near 0.03, four times lower. A moulded plastic wall gets nearly all of its insulation from the foam core and almost none from the polypropylene skins, which are worth having for washability and impact resistance but contribute very little to thermal resistance.
The published figures are representative values measured near room temperature, and they move with density, grade and moisture. The building materials table compiled by Electronics Cooling (2008) gives softwood pine at 0.12 W/(m·K) with a density of 510 kg/m³ and a specific heat of 1350 J/(kg·K), with hardwood oak higher at 0.16–0.17. A 2025 review of bio-based insulation in Energies reports pine across 0.1237–0.1260 W/(m·K) at densities of 450–630 kg/m³, EPS from 0.0313 to 0.0460 W/(m·K) depending on density, and extruded polystyrene at roughly 0.025–0.035. Polypropylene is quoted near 0.22 and high-density polyethylene near 0.45.
| Material | Thermal conductivity k (W/(m·K)) | Typical density (kg/m³) | Specific heat (J/(kg·K)) |
|---|---|---|---|
| Pine, softwood | 0.12 (literature range 0.1237–0.1260) | 450–630 | 1350 |
| Oak, hardwood | 0.16–0.17 | 720 | 1250 |
| Plywood | 0.13 | 590 | 1300 |
| Polypropylene (PP) | 0.22 | Varies by resin — request the data sheet | Varies by resin — request the data sheet |
| HDPE | 0.45 | Varies by resin | Varies by resin |
| Expanded polystyrene (EPS) | 0.030 (review range 0.0313–0.0460) | 15–50 | 1200 |
| Extruded polystyrene (XPS) | 0.025–0.035 | 28–35 | Varies — request the board certificate |
| Polyurethane foam (PU) | 0.025 | Varies by grade | Varies — request the board certificate |
| Still air at 25 °C | 0.026 | 1.2 | 1005 |
Two cautions come with that table. Wood is hygroscopic: the same electronics reference notes that the conductivity of wood can rise by roughly 15 per cent when it is wet, and a timber box after an autumn storm stays wet for days on end. Foam performance depends on cell structure and density, with low-density board doing degraded work. Any supplier quoting an insulation figure should be able to hand you the board certificate stating k-value and density, and if they cannot, treat their R-value as decoration.
Putting thickness onto the k-values
A quoted hive R-value is rarely verifiable, because suppliers usually quote the R of the raw sheet stock rather than the resistance of the assembled wall with its skins, joints, corners and openings. What you can do without a laboratory is take the declared construction and compute resistance yourself from published conductivity values, then compare two quotations on the same basis.
The table below assumes conduction through a flat layer only, ignoring the still-air films on both faces. These figures are calculated, not measured. Real boxes lose heat through the entrance, the roof joint, any upper vent and every mismatch between parts, so use this for ranking alternatives rather than for predicting temperature.
To convert the SI resistance in m²·K/W to the US R-value printed on insulation board, divide by 0.1761.
| Wall build-up | Thickness (mm) | Assumed k (W/(m·K)) | Calculated resistance (m²·K/W) | Equivalent US R (ft²·°F·h/Btu) |
|---|---|---|---|---|
| Solid pine board, standard Langstroth wall | 19 | 0.12 | 0.16 | 0.9 |
| Solid pine board, heavier build | 24 | 0.12 | 0.20 | 1.1 |
| Single polypropylene skin | 2.5 | 0.22 | 0.01 | 0.07 |
| EPS core only | 25 | 0.035 | 0.71 | 4.1 |
| EPS core only | 30 | 0.035 | 0.86 | 4.9 |
| EPS core only | 40 | 0.035 | 1.14 | 6.5 |
| Polyurethane foam core | 30 | 0.025 | 1.20 | 6.8 |
| Two PP skins + 30 mm EPS core | 35 total | 0.22 and 0.035 | 0.88 | 5.0 |
The gap runs around five to seven times, which lines up with figures quoted in beekeeping literature for a wooden wall against a foam-cored one. But the wall is only part of the heat path. Work by Derek Mitchell on cluster thermoregulation makes the point that the standard 19 mm wooden hive conducts heat several times faster than the tree cavities bees evolved in, with the difference estimated at up to seven-fold; the same analysis argues that the cluster mantle is not an insulator at all, its effective resistance falling sharply as bees crowd together.
For a buyer this explains why two hives with the same wall material can behave differently in the field. An upper entrance, an unsealed roof joint or a gap at the floor can dominate the heat budget of an otherwise well-insulated box. Specify the openings, not just the wall.
Thermal mass is the number nobody quotes
Resistance decides how fast heat leaves. Mass decides how far the internal temperature swings while that happens. A heavy wall absorbs heat during a warm afternoon and releases it overnight, flattening the cycle inside the hive, while a light wall chases the outside air almost immediately.
The two types differ by more than an order of magnitude. A 19 mm pine board stores about 13 kJ of heat per square metre per kelvin — thickness multiplied by density multiplied by specific heat, taking the values from the first table. Thirty millimetres of EPS at 25 kg/m³ stores about 0.9 kJ/(m²·K). That is roughly fifteen-fold, and it is arithmetic rather than a marketing claim, so it will hold for any supplier’s product built to those dimensions.

Timber’s advantage here is genuine but narrow. It damps a short cold snap and smooths a sunny winter afternoon, which matters most for small colonies in climates with wide day-to-night swings, and it is why some operators keep timber for shoulder seasons even after conceding that foam wins on steady-state losses.
Low mass cuts both ways for the insulated box. It warms quickly under morning sun, so the colony starts flying earlier, and it cools just as quickly once the sun leaves. In a climate with a 30 °C daily swing that behaviour is real, and the colony pays for the missing buffering either in stored honey or in lost brood.
The polymer skins do add heat storage, and the amount depends on declared skin thickness and resin density. This is a fair question to put to any factory: give me skin thickness, core thickness and both densities and the whole picture can be modelled before an order goes in.
Condensation follows the coldest surface
Water kills more winter colonies than cold does. Bees metabolise honey, exhale water vapour, and that vapour condenses on the first surface it finds below dew point. When that surface is the inner face of the roof directly above the cluster, the condensate drips back onto the bees. Cold water landing on a winter cluster does more damage than cold air around it.
Insulation moves the target. Warm the roof and the vapour keeps travelling until it reaches a colder surface further out, usually the upper side walls and the end frames away from the bees, where it condenses without touching the cluster, or it leaves through an upper vent. Insulating the roof alone captures most of that gain, because the warm moist air goes up.
The measured evidence supports the humidity argument. Alburaki and Corona ran eighteen matched colonies, nine in polyurethane hives and nine in conventional Langstroth timber hives, with sensors logging both temperature and humidity; the work appeared in the Journal of Apicultural Research (2022, 61(2):190–196, DOI 10.1080/00218839.2021.1999578). The polyurethane hives held a mean inner temperature of 10.20 ± 0.04 °C against 9.73 ± 0.05 °C for timber, significant at P < 0.001. The wider gap was moisture: 52.05 per cent relative humidity in the polyurethane hives against 62.50 per cent in the wooden ones, and the wooden hives showed far larger swings between day and night.
That result matters to a purchasing decision because it isolates a mechanism rather than a claim. Ten percentage points less humidity sitting above a winter cluster is a real reduction in the conditions that drive mouldy comb, fermented stores and dysentery, and it comes from the enclosure rather than from anything the beekeeper does differently.
What the trials say about winter feed and survival
Feed consumption is where the physics has to be tested against live colonies, and one randomised trial is worth knowing. St. Clair, Beach and Dolezal followed forty-three colonies across eight apiaries in central Illinois, published in PLoS ONE in 2022 (17(4):e0266219). Colonies given an insulated hive cover consumed less of their stores and survived better than uncovered controls, with survival 22.5 per cent higher.
Read that figure with the loss rates around it. The same paper records US average winter losses of 32.2 per cent over 2020–21, with some states reaching 58 per cent, and EU average losses of 16.7 per cent over 2018–19 with country figures up to 32 per cent. Beekeepers in those surveys described 23.3 per cent as the loss rate they find acceptable. Measured against that background, a 22.5 percentage-point survival difference is not a small effect.
The second finding is the one that changes how you buy. Mean internal temperature over the winter did not differ much between the groups. The difference showed up in how much food was burned to hold whatever temperature the bees chose. Insulation does not heat a colony; it lowers the fuel bill, and the saving arrives as honey or syrup left in the box in spring.
There is a limit to what the evidence supports, and it should be stated plainly. A review written for apicultural advisers notes that no trial has established an optimal wall thickness, a target R-value or a universally superior material, largely because field studies tend to change several variables at once — roof, sides and ventilation together — so the benefit cannot be split between them. The same review points out that colony population going into winter predicts overwintering success more strongly than any property of the box. A better wall will not rescue a weak colony or one carrying high mite loads.

Scale is still available even if precision is not. Under the most adverse management reported — colonies held under refrigeration to force a brood break — winter consumption has been put as high as about 60 kg of honey. Against that, an older estimate is worth keeping in view: Wedmore’s 1947 calculation, as cited in current beekeeping writing, put the basic winter requirement at roughly three pounds a month between mid-October and mid-April, about 21 lb in total. Most operations provision several times that amount. The difference between the basal requirement and what actually disappears is fuel burned to replace heat escaping through the box, and that is exactly the cost a better enclosure attacks.
Summer turns the same property around
Every point above applies in hot weather, only inverted. A wall that resists heat loss in January resists heat gain in July. In warm export markets this is usually the stronger commercial argument, and it explains why an insulated three-layer insulated plastic hive sells as readily into hot regions as into cold ones.
The recent desert evidence is specific. A study monitoring nine colonies for three months through a desert summer, where shaded air maxima intermittently exceeded 40 °C, found brood-area temperatures averaging within the 34–36 °C band needed for healthy brood development. The finding worth acting on was not the average but the excursions: brood spent roughly 14 per cent of each day at the brood centre and 33 per cent at the brood edge outside the optimal band, and colonies exposed to higher maxima and larger internal swings declined in population. Cooling costs foragers, and there is a ceiling beyond which the colony cannot pay.
Field accounts point in the same direction. BroodMinder monitored hives through a heat wave that peaked at 47.4 °C in full sun and reported that healthy production colonies and nucleus colonies held brood between 35 and 36 °C in wooden, polystyrene and plastic hives alike, while weak or broodless colonies tracked outside conditions far more closely. That is a sensor manufacturer’s own dataset rather than a peer-reviewed trial, and it should be read as such, but the pattern agrees with the published work: the enclosure helps, and colony strength helps more.
Australian experience adds the commercial dimension. ABC News reported in 2017 on a Clermont, Queensland operator who had moved about 80 per cent of his operation into polystyrene and who reported roughly 35 per cent higher production in hot weather, attributing it to bees flying instead of fanning. One operator’s account is a report, not data, and we would never put it in a specification. The same account, though, carries a warning worth remembering: comb wax softens around 60 °C, and a colony that overheats badly can collapse into a melted mass at the entrance.
Buyers in the southern hemisphere and the Gulf should weigh two things the cold-climate literature skips. Insulation slows the escape of metabolic heat at night as much as it slows incoming heat by day, so a well-insulated box in a hot climate needs a working upper vent rather than just a thick wall. Roof colour, shade and ventilation do as much work as wall construction in those markets — ask what happens at the roof, not only at the sides.
Two calendars for the same decision
Season flips what you should be optimising for, and northern and southern buyers read this article in opposite months.
Northern hemisphere (North America, Europe, UK). November to February is cluster season. Colonies are shut down, inspections stop, and the only checks are weight, entrance clearance and mouse guards. Insulation decisions for this winter are already made; the work now is measurement and purchasing. Weigh hives or use axle scales before January and again at the end of February so you have your own consumption numbers rather than someone else’s claim, then buy against those numbers for next autumn. Practical detail for British operations, including winter inspection calendars, sits with the National Bee Unit.
Southern hemisphere (Australia, New Zealand, Chile, Brazil, South Africa). November to January is the opposite picture: spring build-up, swarm control, queen rearing and the approach of the main honey flow. Thermal priority shifts from keeping heat in to getting heat and humidity out. Ventilation, shade and a light-coloured roof matter more than wall thickness now, and box decisions made in this window should be aimed at the January–February heat peaks rather than at winter. The USDA’s honey bee research programme publishes openly on colony thermoregulation and heat stress, and is the best neutral entry point: USDA Agricultural Research Service.
The Oregon State University Extension service is also worth bookmarking for regional calendars, and the FAO pollination pages carry background on why colony condition drives much of the outcome, whatever the box is made of.
Weight, cube, freight and what to ask for
This is where procurement actually feels the difference, and where we refuse to publish numbers that depend on the exact product. A moulded foam-cored body is lighter than a solid timber one of the same outside dimensions, but how much lighter depends on skin thickness, core density and whether you take the standard or heavy-duty floor and roof. We will not quote a kilogram figure in an article; ask for the packing list and the loading plan for the specific model, because those two documents are what your freight forwarder will price from.
Three commercial effects follow from the weight difference, and they compound on a full container.
Freight cost per unit. Lighter bodies mean more units per container before you hit weight limits, or lower cost per unit at the same count. Ask the factory for sets per 40 ft high-cube with a stated packing configuration.
Handling on the ground. Crew fatigue and injury rates follow box weight more closely than most operations admit. A body that can be lifted one-handed changes how fast a yard can be worked, and that is a labour cost line rather than a carbon footprint argument.
Nesting and cube. Some insulated designs nest or flat-pack, which can move the landed number further than material choice does. If your route is expensive or your warehouse is tight, ask for both assembled and flat-packed cube figures before deciding.
Service life, repairs and end of life
Longevity claims are where this product category tells the most lies, so here is the honest position: service life varies by model, UV exposure, handling and climate, and any figure a factory quotes should come with the test method behind it. Ask for it, in writing.
The mechanisms are not in dispute. Polymers degrade under ultraviolet light, so ask what stabiliser package is used and whether there is any accelerated weathering data behind the claim — outdoor life is mostly a UV question, not a strength question. Timber takes paint, oil or plastic coating and needs it redone; untreated boxes absorb water, which raises conductivity as noted above and then invites rot at the joints and floor corners. Termites and carpenter bees are a regional consideration that no amount of foam solves.
Repairability runs the other way to purchase price. Timber is repaired on site with a hammer, a screw and a sheet of sandpaper, and a cracked board is a ten-minute job in the field. A cracked moulded body usually means replacing the part, which works fine if your supplier holds spares and badly if it does not — ask what spare parts are stocked and for how many years.
End of life is worth a line in any tender document, particularly for European buyers working under their own waste rules. Timber is recyclable, repairable and usable as fuel at end of life, and it can be chipped. Expanded polystyrene has limited recycling streams outside industrial collection schemes, and it takes volume in a skip. Polypropylene skins are recyclable in principle, though in practice they are usually disposed of as mixed plastic. None of that changes the physics, but it is starting to appear in procurement questionnaires, and it is cheaper to answer now than during a tender.
Comparing quotations line by line
The practical way to settle this for your own operation is to stop comparing labels — plastic against wood — and start comparing declared construction. Every row below can be answered by any competent factory, and any row that cannot be answered tells you something about that supplier.
| Line to compare | Insulated plastic (foam-cored) | Timber (pine or cedar) | Evidence to ask for |
|---|---|---|---|
| Wall construction | Skin thickness + core material + core thickness, all in mm | Board thickness in mm, species, joint type | Factory drawing and bill of materials |
| Core or board conductivity | Varies by model — request the test report | Varies by species and moisture — request mill data | Board certificate stating k-value and density |
| Calculated wall resistance | About R 5.0 for dual skins + 30 mm EPS core | About R 0.9 for a 19 mm pine wall | Calculated from declared thickness and published k; verify the thickness yourself |
| Wall heat storage | About 0.9 kJ/(m²·K) for a 30 mm EPS core | About 13 kJ/(m²·K) for 19 mm pine | Calculated from thickness, density and specific heat |
| Dry mass per body | Varies by model — request the packing list | Varies by model — request the packing list | Signed packing list for the exact SKU |
| Units per 40 ft high-cube | Varies by model and packing — request the loading plan | Varies by model and packing — request the loading plan | Written loading plan; check whether units ship assembled or nested |
| Declared service life | Varies — request UV stabiliser data and weathering results | Varies — request treatment specification and coating schedule | Test method named on the report, not a number alone |
| Ventilation provisions | Upper vent area, roof seal, entrance options, stated in cm² | Same — stated in cm² | Drawing plus photos; this drives the summer outcome |
| Spares availability | Named spare parts and stock period | Named spare parts and stock period | Written commitment in the quotation |
Fill that table in for every quotation and the argument usually settles itself. If you want the timber side, start with a single-layer wooden hive or the mixed pine and cedar hive kits, which cover both single and double wall requirements. On the moisture question specifically, a timber quilt box above the brood nest is the cheapest retrofit available to anyone running existing timber boxes, and it works with either material below it.
The honest summary: neither foam nor timber is a shortcut past good management. Insulation buys you lower fuel consumption, a drier roof and better-buffered nights, and it usually costs more per unit and gives up on-site repairability. Buy it for the cost row you are actually trying to move, and make the supplier write the numbers down before you sign.