
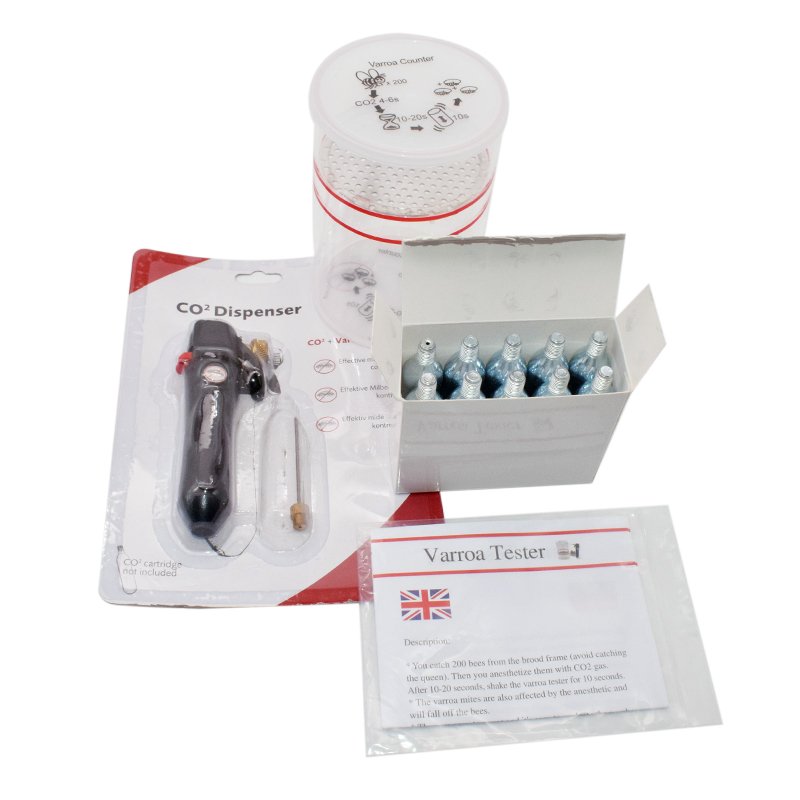
Varroa is the one pest where the decision to treat can be made with a number rather than a feeling. Almost every other judgement in the apiary is a mixture of experience, weather and instinct; mite load is not. Take a half cup of bees, wash them, count the mites, divide, and you have a figure that tells you whether to act this week or wait a month.
The complication is that the figure only means something if the method is known. An alcohol wash and a sugar roll on the same colony will not give the same answer, and the thresholds that extension programmes publish are tied to specific methods. This article sets out the thresholds, what each counting method does to the number, how to build a sampling plan that fits an operation, and the questions that come up most often when people start testing seriously.
Where the thresholds come from
The numbers most North American and increasingly European programmes use come from the Honey Bee Health Coalition’s varroa management guidance, which consolidated field research and extension data into a set of action bands. The key idea is that a fixed infestation level does not carry a fixed risk: the same mite count is tolerable when a colony is building and dangerous when it is shrinking into winter.
That is why the guidance is arranged by colony phase. Mite numbers grow with brood, so a colony rearing heavily is producing mites as fast as it is producing bees, and a moderate count in April can become a damaging one by July. Conversely, when brood rearing stops, the mites have nowhere to reproduce and the phoretic population on adult bees becomes the whole population — which is both easier to measure and more dangerous per mite.
Thresholds by colony phase
Infestation is expressed as mites per 100 adult bees. In practice the sample is about 300 bees, roughly a half cup, so every three mites in the jar is one percentage point.
| Colony phase | Acceptable — wait | Caution — control may be warranted | Danger — control promptly |
|---|---|---|---|
| Dormant with brood | Below 1% | 1–2% | Above 2% |
| Dormant without brood | Below 1% | 2–3% | Above 3% |
| Population increase | Below 1% | 2–3% | Above 3% |
| Peak population | Below 2% | 3–5% | Above 5% |
| Population decrease | Below 2% | 2–3% | Above 3% |
Read that table as a set of bands rather than a cliff. The HBHC guidance is explicit that these are not biological thresholds: colonies have survived above the danger band and crashed below it. What the bands mark is the level above which research repeatedly shows colony performance falling and winter survival dropping off.
Two rows deserve comment because they surprise people. The peak-population band is looser than the spring band not because mites are less harmful in July but because the colony has the population to absorb them, and because a summer treatment that wipes out a colony’s brood cycle has a cost of its own. And the dormant-without-brood band is tighter in practice because almost all mites are phoretic then, which makes an alcohol wash read close to the true load and makes a broodless treatment far more effective.
Four counting methods, four answers
Every method samples the same colony by a different route, and the routes catch different fractions of the mite population. Choosing a method is choosing a number.
| Method | Sample | Mite recovery | Practical note |
|---|---|---|---|
| Alcohol wash | About 300 bees, half cup | About 95% | Reference method; the sampled bees do not survive |
| Sugar roll | About 300 bees, half cup | About 60–70% | Bees survive; the count runs low, so read it conservatively |
| CO2 knockdown | About 300 bees in a chamber | High, comparable to the wash | Bees survive; needs a cartridge and a chamber |
| Sticky board drop | Whole colony, 24 or 48 hours | Indirect, highly variable | No bees lost; affected by population, temperature and recent treatment |
The comparison that matters most is powdered sugar against alcohol. Across comparative studies the sugar roll recovers roughly 20 to 40 percent fewer mites than an alcohol wash on the same colony. A sugar roll reading of 1.5 percent can correspond to a true load near 2 to 2.5 percent. Where sugar rolls are the chosen method, the honest response is to tighten the trigger rather than waiting for the published percentage.
CO2-based testers exist precisely because they address the weakness of both: the bees are not killed, and the knockdown is close to the alcohol wash. They require a cartridge and a chamber, which adds a consumable and a piece of kit to carry, and they are at their best when the operator follows the same timing every session.
Sticky boards are a screening tool rather than a decision tool. The traditional figure quoted is 8 to 9 mites per 24 hours during the brood season, but that figure assumes a colony of roughly 40,000 bees. Drop the same number of mites from a five-frame nucleus and the colony is in serious trouble. Board counts also move with weather and colony size regardless of mite biology, which is why they are best used to detect a change rather than to set a trigger.
The wash, done properly
The alcohol wash is the method most thresholds are written against, and the steps are the same whether the sample cup reads 300 bees or 250.
Find the frame that carries the mites, not the frame that carries the most bees. Varroa concentrates on nurse bees, so the sample comes from a frame of open brood in the middle of the nest rather than an outer honey frame. Shake or scoop about 300 bees into the wash jar, close it, and shake hard for about a minute. The point of the minute is not the killing; it is the agitation that strips mites off the bees.
Strain into a light-coloured bowl so the mites can be seen against the background, then count bees and mites separately. Bees are counted as a full sample; dividing mite count by bee count and multiplying by 100 gives the percentage. Six mites in 300 bees is 2 percent.
Three operator habits decide whether the number is worth anything. Shake for the full time every time, because a fifteen-second wash returns a lower count than a sixty-second one on the same colony. Check the sample is roughly 300 bees rather than a third of a cup, because the percentage is a ratio and a small denominator inflates it. And do not count a mite that was already on the bees rather than in the bowl — or rather, do, and record the method, because that inconsistency is what makes two people’s numbers disagree.
Where bees must survive, use the sugar roll or a CO2 tester, and calibrate the expectation: a sugar roll is a screen, and a CO2 tester is much closer to a wash. Whichever is used, use the same one all season, because a trend line built on one method is worth more than a single reading taken with the most accurate tool.
Where sampling goes wrong
Most bad mite counts are not bad luck. They come from one of four habits, and each one pushes the number in a known direction.
Sampling the wrong frame. Bees from an outer honey frame or the entrance carry a different mite load from nurse bees on open brood. Sampling away from the brood nest usually reads low, sometimes by a wide margin, and the colony that looked fine in June is the one that collapses in October.
Sampling too few bees. The percentage is a ratio, and with a small sample a single mite moves it several tenths of a point. A reading built on 80 bees is closer to a guess than a measurement. Where the sample is genuinely small, record it as such and treat the result as a screen.
Mixing methods across the season. A trend line only means something if each point was taken the same way. Switching from wash to sugar roll mid-season produces a drop in the number that has nothing to do with the mites.
Testing once and filing it. A single count describes one afternoon. It says nothing about the trajectory, and the trajectory is what decides whether an intervention is needed this month or can wait until the next. Where only one test a season is realistic, put it in the late-summer window, because that is the one that decides whether the colony survives winter.
Turning counts into a calendar
The practical value of a threshold is that it converts a judgement call into a scheduled check. Rather than deciding each week whether mites look bad, the operation decides in advance which counts trigger which action, and the season becomes a series of dates.
A calendar built this way has three fixed points. An early-season check to establish the baseline before the population builds. A mid-season check to catch the colonies that are climbing faster than the rest. And the late-summer window, where the threshold tightens and the treatment has to finish early enough for the winter bees to be reared without mite-vectored virus pressure.
The timing constraint is the part that catches people out. A treatment that needs several weeks and has to be removed before the honey flow works only if it is started early enough, and a treatment that must not be applied while supers are on has a window that closes when the flow starts. Working backwards from these constraints — rather than forwards from a mite count — is what keeps a plan executable.
What changes at scale
Testing ten colonies is a chore. Testing four hundred is a system, and the system has to be designed rather than improvised.
At scale the sampling unit changes. Instead of testing each colony, an operation samples a fixed proportion per apiary per round and records it against a rolling average, which turns monitoring into something that can be scheduled with the same labour budget every month. Where colonies are managed individually — breeding stock, nucleus production — they come out of the sampling pool and get tested one by one.
The second change is that records have to be centralised. A count written on a hive lid is lost the moment the lid is changed. A count in a shared sheet, keyed to apiary and date, is what lets a manager see that one yard is consistently two points above the rest and needs a different plan.
The third is that treatment becomes a logistics problem. Ordering enough product, scheduling crews, and removing strips on schedule is operationally harder than the decision itself, and the failures at scale are usually failures of scheduling rather than of diagnosis.
Building a sampling plan
How often to test, and how many colonies, depends on the size of the operation and on how fast the population is changing.
The baseline most programmes recommend is monthly through the active season — roughly April to October in the northern hemisphere — with checks every two weeks in the late-summer window. The reason for the tighter interval in August and September is arithmetic: mite populations can double in under a month while brood is being reared, and the bees that are being reared in that window are the ones that carry the colony through winter. A colony that looks fine at the start of August can be past saving by the end of September.
How many colonies to sample per apiary is the question people ask less often, and it matters more. Mite loads vary substantially between colonies sitting a metre apart, so a single sample describes one colony rather than an apiary. Where an apiary is managed as a unit — all treated together, all moved together — sample enough colonies to estimate the apiary: in practice a handful spread across the site, and ideally the same ones each time so the trend is comparable. Where individual colonies are managed separately, sample each one and record individually.
The record is more useful than the reading. Date, apiary, colony identifier, method, sample size, mite count, and what was done in response. Over a season that turns into something a manager can act on: which apiaries run hot, which treatments worked, and how quickly loads recover after treatment.

What to keep in the testing kit
Testing gets skipped when the kit is not together. Everything needed fits in one box that lives with the extraction equipment.
Sample jar and a strainer lid. A jar with a wide mouth, and a lid or separate sieve that holds the bees while letting liquid and mites through. The mesh has to be fine enough to hold bees and open enough to pass mites, which is a narrower spec than it sounds.
Washing liquid. Methylated spirits or a soap solution for the wash; icing sugar for a roll. Whichever is used, it needs to be in the box rather than fetched.
A light-coloured tray. Dark mites on a dark surface is how counts get missed. A white or pale tray with a little water in it makes the mites move and stand out.
A half-cup measure and a tally counter. The measure keeps sample sizes consistent; the tally counter keeps the count honest when the tray is busy.
The record sheet. Paper or tablet, dated, with columns for apiary, colony, method, bee count, mite count, percentage and action taken. The last column is the one everyone forgets and the one that makes the rest worth collecting.
After treatment, test again
The step that gets skipped is the second sample. A treatment that was applied to a colony with heavy brood will only reach the phoretic mites; the ones inside capped cells emerge afterwards and rebuild the population. Without a follow-up count, a failed treatment looks like a successful one until the colony collapses in autumn.
Sample again after the treatment cycle is complete and the product has been removed, and compare against the same threshold for the current colony phase. If the count has not fallen below the danger band, the product, the timing or the application was wrong, and the window for a second attempt is closing. This is also the check that catches resistance: a product that previously brought counts down to near zero and now leaves them at 3 percent is telling you something that no amount of reapplication will fix.
Rotating actives before they stop working
Mite populations develop resistance to synthetic acaricides, and the history of fluvalinate and, later, amitraz is the standard cautionary example. Rotation is not a formality to be noted in a logbook; it is the mechanism that keeps a product useful. The practical rule is to alternate between modes of action between treatment cycles and between seasons rather than repeating the same active because it worked last time.
Temperature and honey-flow constraints interact with this, because several of the soft acids have narrow windows where they are both effective and legal to apply with supers on. The rotation plan and the calendar have to be designed together, which is easiest to do at the start of the season rather than in the middle of it.
The Honey Bee Health Coalition publishes the varroa management guidance these thresholds come from, including the full sampling and control guide, and both are worth keeping to hand in the honey house. National programmes publish their own figures on losses and management, including the US beekeeping survey, and the FAO’s pollination pages cover the wider context of pollinator health and management.
On the testing kit itself, the choice between methods comes down to whether the bees can be sacrificed and how precise the count needs to be. A CO2 varroa tester gives a wash-grade count without killing the sample, while a varroa easy check is the simpler field option for routine screening. Where counts come back in the danger band, the timing of the response matters as much as the product: oxalic acid vaporising works best during a broodless period, which is why the late-autumn window and the late-summer threshold sit together in every management calendar. General pest monitoring supplies sit in the pest catcher range.

Thresholds are a floor, not a target
A threshold tells you when the cost of inaction exceeds the cost of action. It does not tell you the colony is healthy below it. Treating at the danger band means treating after measurable damage has started, which is a reasonable optimisation for an operation with hundreds of colonies and a real budget constraint, but it is not the same as good mite management.
Operations that keep losses low tend to use thresholds differently: not as a trigger to react, but as a check on whether the plan is working. If counts are consistently near the top of the acceptable band at every check, the management system is running close to the line, and any disruption — a poor autumn, a missed treatment, a warm winter — will push it over. If counts sit near zero with the same monitoring effort, there is margin.
There is also the matter of neighbouring apiaries. A collapsing colony releases bees carrying mites, and those bees drift into and rob out nearby hives, which is why an untreated high-mite colony raises mite loads across a district rather than just in its own yard. Where several beekeepers operate within a few kilometres, the threshold is a shared problem, and monitoring one’s own colonies is part of the deal.
Questions that come up in the first season of testing
How many bees is a half cup? Roughly 300 workers, but weighing the sample is more reliable than measuring it, because bees cluster and a cup can hold more or less depending on how they settle. Whatever the method, the percentage calculation needs the actual bee count, not an assumed one.
Can I test in the rain or on a cool day? Testing is about the sample, not the weather, but a cool day means foragers are home, which changes which bees end up in the jar. Sample from the brood nest either way, and avoid days when the colony is clustered.
Should I count mites on the bees or in the bowl? Both, and add them. Mites that fall off are the point of the wash; mites still attached to the bees in the bowl are part of the same population and belong in the count.
Is one colony per apiary enough? No, unless the apiary is very small. Loads vary between colonies, so a single sample cannot represent a yard. Sample several colonies, note the spread, and treat on the worst rather than the average where the apiary is managed as a unit.
What should the count be after treatment? Below the threshold for the current phase, and ideally well below it. Where a follow-up count still sits in the danger band, something about the application, the product or the timing was wrong, and resistance should be considered before repeating the same active.
Do resistant or hygienic stocks still need testing? Yes. Resistant and hygienic lines can suppress mite reproduction, sometimes enough to keep colonies below threshold without treatment, but the effect varies by colony, by line and by season. The only way to know whether genetics are doing the work is to keep counting.