
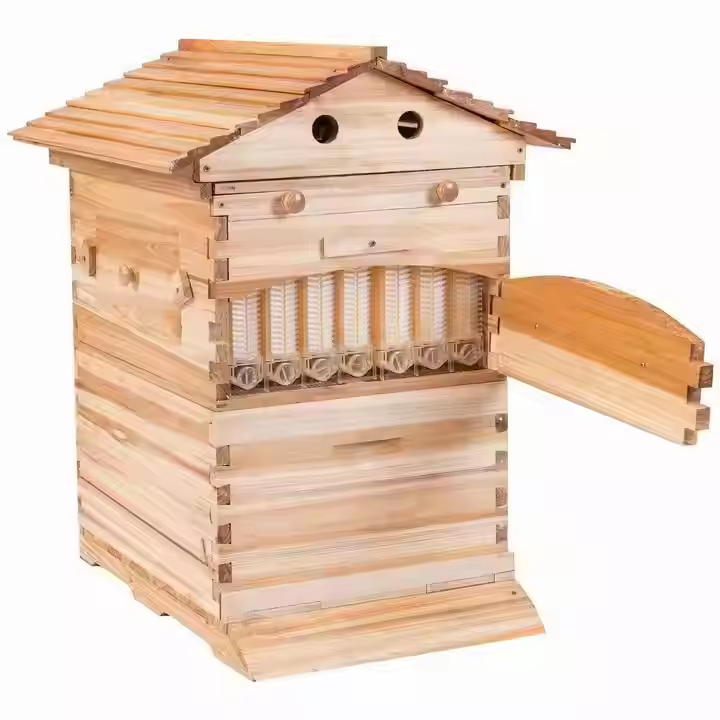
A colony loss number is not a beekeeping statistic to most of our customers. It is a purchase order. When a national survey says US beekeepers lost 39.9% of managed colonies in a year, the arithmetic that follows is simple: roughly four in every ten hives have to be refilled with bees, and every one of those holes needs a bottom board, boxes, frames, foundation and a lid. That is the us colony loss data equipment buying cycle in one sentence, and it is the reason a factory in China can read an American loss survey and predict what its distributors will order next spring.
This article is written for operations running a few hundred to a few thousand colonies and for the importers who supply them. We work backwards from the published numbers to a unit count, then forwards to a delivery calendar. Every percentage here is quoted from a named source and year. Where a figure depends on your operation rather than on published data, we say so and give you the cell to fill in.
What the 39.9% figure actually measures
The 2025–2026 US Beekeeping Survey is run by Auburn University, Oregon State University and the Apiary Inspectors of America, continuing the series the Bee Informed Partnership started in 2007. The results for the year 1 April 2025 to 1 April 2026 are published as a preliminary analysis on the Apiary Inspectors of America survey page, with a peer-reviewed paper to follow.
The headline: beekeepers lost an estimated 39.9% [30.1–53.1 CI] of managed colonies over the full year. That sits 15.7 percentage points below the previous year and 2.4 points below the running 15-year average annual loss of 42.3%.
Split by season, the same survey reports 23.3% [18.05–29.2 CI] summer loss (1 April to 1 October 2025) against a 15-year summer average of 23.7%, and 30.3% [21.4–41.5 CI] winter loss (1 October 2025 to 1 April 2026) against an 18-year winter average of 29.9%. Winter is where the damage concentrates, which matters for procurement because it means the rebuild demand lands in a narrow window rather than spreading across the year.
Two qualifications belong next to those numbers. First, the confidence intervals are wide — 30.1% to 53.1% on the annual figure. Plan with the range, not the point estimate. Second, the survey authors state plainly that loss rates are a mortality rate, not a change in population: beekeepers replace colonies during the year, so a high loss rate does not automatically mean fewer hives. For an equipment buyer that distinction is the whole story. Death creates demand for hardware; replacement converts that demand into orders.
Beekeepers themselves described 21.1% winter loss as “acceptable” in the 2025–2026 survey. Steven Coy, president of the American Honey Producers Association, put the industry target at 15–20%. Neither number is close to what the survey measured, and that gap is the structural driver of replacement demand in this market.
The two record years behind it, and what they did to inventory
The 39.9% figure reads as an improvement only because of what preceded it. The same survey series recorded 55.1% annual loss in 2023–24 and 55.6% in 2024–25, with winter 2024–25 loss at 40.2% — the highest since tracking began. Those two years removed a large share of the standing colony count and, with it, a large share of the equipment that was in service.
The federal inventory count shows the same event from a different angle. USDA NASS counts colonies on operations with five or more hives at four points a year; the NASS bee and honey survey programme publishes the series. Its release of 3 August 2026, covering operations with five or more colonies, reports the following.

| Measure (operations with 5+ colonies) | Value | Period |
|---|---|---|
| Colonies on 1 January | 2.81 million, up 6% year on year | 1 Jan 2026 |
| Colonies on 1 April | 2.84 million | 1 Apr 2026 |
| Quarterly inventory, 2025 | 2.64M (Jan 1), 2.88M (Apr 1), 3.12M (Jul 1), 2.95M (Oct 1) | 2025 |
| Colonies lost | 454,890 colonies, 16% of inventory | Jan–Mar 2026 |
| Colonies lost | 321,910 colonies, 11% of inventory | Apr–Jun 2026 |
| Colonies lost | 347,100 colonies, 12% of inventory | Oct–Dec 2025 |
| Colonies added | 464,320 colonies | Jan–Mar 2026 |
| Colonies added | 619,850 colonies | Apr–Jun 2026 |
| Colonies added | 170,560 colonies (lowest quarter of 2025) | Oct–Dec 2025 |
| Colonies renovated (requeened or given a nuc/package) | 215,440 colonies, 8% | Jan–Mar 2026 |
| Colonies renovated | 507,890 colonies, 18% | Apr–Jun 2026 |
| Colonies affected by Varroa mites | 21.8% (Jan–Mar 2026), 26.3% (Apr–Jun 2026) | 2026 |
Read the additions column carefully, because it is the closest thing to a demand calendar that exists in public data. In the first half of 2026 US beekeepers added more than 1.08 million colonies, and 18% of the standing inventory was renovated — requeened or restocked — in the second quarter alone. The fourth quarter added roughly a fifth of what the second quarter did.
The implication for anyone buying equipment is not subtle. Rebuild activity is concentrated in the first six months of the calendar year in the United States. Goods that arrive in November are useful. Goods that arrive in April are late for the split season and early for nothing.
Turning the colony loss percentage into a unit count
Here is the conversion, stated so you can run it on your own numbers.
Step 1. Colonies lost = colonies managed × loss rate. Use the range, not the midpoint: run your plan at 30% and at 53% and see whether the order size changes your freight decision.
Step 2. Decide how much of that loss you rebuild with bought bees versus splits. Both routes consume equipment, but they consume different equipment at different times.
Step 3. Multiply by the hardware set each route needs.
Step 4. Add frame attrition that is independent of loss — broken frames, wax moth damage, comb you are rotating out on purpose.
Worked example, 1,000 colonies at 39.9% annual loss: 399 colonies lost. At the low end of the confidence interval (30.1%) it is 301; at the high end (53.1%) it is 531. That spread of 230 colonies is the difference between a part-container order and a full one for most items, and it is the single most useful reason to hold a safety stock rather than ordering to the point estimate.
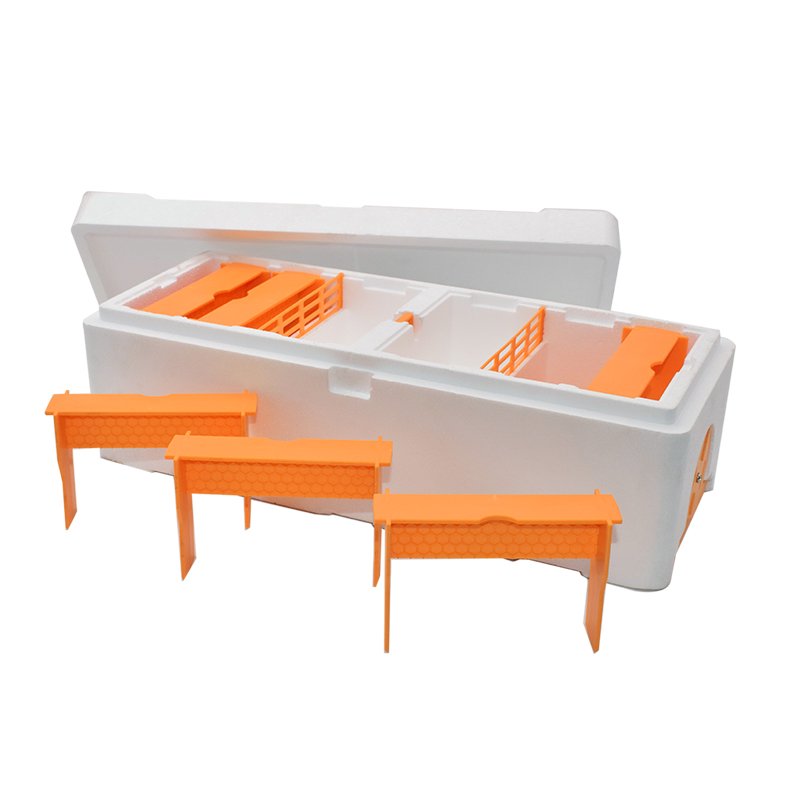
The table below converts 100 lost colonies into a parts list for two rebuild routes. Frame counts assume 10-frame Langstroth deeps; adjust the multiplier if you run 8-frame or Dadant equipment, because this is where most ordering errors happen.
| Item | Route A: package into a full 10-frame colony | Route B: 5-frame nuc split from survivors | Note |
|---|---|---|---|
| Bottom boards | 100 units | 0 (nuc boxes used instead) | Solid or screened; a screened floor needs a tray |
| Brood boxes, deep | 100–200 units | 0 at split time | Two boxes only if you winter double-deep |
| Deep frames with foundation | 1,000–2,000 units | 500 units | 10 frames per deep box, 5 per nuc |
| Nuc boxes, 5-frame | 0 | 100 units | Reusable; many operations hold these permanently |
| Inner covers | 100 units | 0 | Often skipped in warm climates |
| Outer covers | 100 units | 100 units | Nucs need a lid of their own |
| Feeders | 100 units | 100 units | New colonies on foundation need feeding |
| Entrance reducers / mouse guards | 100 units | 100 units | Cheap, and always the item that runs short |
| Frames per lost colony | 10–20 | 5 at split, 10–20 on transfer | Route B defers the full box order by one season |
At 1,000 colonies and 399 losses, Route A at two deep boxes per colony is 7,980 deep frames, plus 399 bottom boards, 798 boxes and 399 of each lid type. Route B is 1,995 frames and 399 nuc boxes this season, with the full boxes and frames following when the nucs outgrow them.
Run the same arithmetic at the ends of the confidence interval. At 30.1% loss the Route A frame order is 6,020; at 53.1% it is 10,620. That is a range of 4,600 frames on a 1,000-colony operation — and it is why the order should be placed in two parts rather than one.
Which route you choose is decided by bee availability and price, not by equipment. What the equipment buyer needs to know is that the two routes place the order in different quarters, and a supplier who only quotes one configuration will be wrong for half the market.
Frames are the line item that decides the container
In a rebuild order, frames dominate by count and usually by volume. A deep Langstroth frame is a thin, awkward shape that does not nest well; the carton is mostly air unless the supplier ships frames knocked down or flat-packed with foundation separate. Ask two questions before you accept a freight quote: how many frames per carton, and what are the carton dimensions. Then ask how many cartons fit a 40-foot container, in writing.
Comb rotation adds a second, steadier demand on top of loss. If you cycle brood comb so that every frame is replaced every five years, that is 20% of your frames per year regardless of what the loss survey says. On 1,000 colonies at 20 deep frames each, that is 4,000 frames a year before a single colony dies. For most operations the rotation number is larger than the loss number, and it is far more predictable — which makes it the better basis for a standing annual order.
Add the two and you get the real annual frame requirement: replacement of losses plus rotation, minus usable drawn comb salvaged from dead-outs. Salvage is the variable most buyers forget to subtract. Frames from a colony that died of mites or starvation are often perfectly usable after cleaning; frames from a colony that died with foulbrood symptoms are not, and in many jurisdictions should not be moved between apiaries at all.
When the equipment has to be in the warehouse
Public data gives you the demand window. Your own logistics give you the order date. The arithmetic is: order date = date goods are needed − (production lead time + ocean transit + customs clearance + inland delivery).
Northern hemisphere — United States, Canada, Europe:
- January–March: the heavy rebuild quarter. NASS recorded 464,320 colonies added and 16% of inventory lost in Jan–Mar 2026. Equipment for this work must be in the warehouse by December.
- April–June: the split and requeening quarter — 619,850 colonies added and 18% of inventory renovated in Apr–Jun 2026. Nuc boxes, frames and queens. Equipment in the warehouse by March.
- July–September: harvest, mite treatment, and the point at which you know your actual winter loss. Also the window to place next year’s order.
- October–December: winter preparation and the lowest-activity quarter for additions — 170,560 in Oct–Dec 2025. Shipments landing now are for next quarter’s work.
Southern hemisphere — Australia, New Zealand, Chile, Argentina, Brazil, South Africa. Mirror the calendar by six months:
- July–September: late winter, pre-build-up. Rebuild equipment must be on hand by August.
- October–December: spring build-up and the main split window; the southern equivalent of the US second quarter. Nucs, frames, queens.
- January–March: main flow and harvest.
- April–June: autumn feeding, mite treatment, winter packing. Place the following season’s order now.
That mirror matters commercially. A factory shipping to both hemispheres has a genuinely two-peaked order book, and a distributor in Melbourne and a distributor in Minnesota are placing the same order in opposite quarters. If you run both, consolidation is possible: one production run, two sailing schedules.
On lead times, we will not publish a number, because it varies by specification, season, port and carrier, and a figure quoted here would be stale before you read it. Get a written door-to-door date from your supplier and your forwarder for your specific order, then work backwards. What you should insist on is a date stated as a calendar date rather than “30–45 days”, because the latter is not a commitment you can plan a rebuild around.
Order splitting: one container or two
Loss data arrives once a year and it is always late. The survey covering April 2025 to April 2026 was collected in April 2026 and reported mid-2026, which is after the window in which most of the equipment was needed. Nobody can order precisely against the number.
The practical response is a two-part order. Place a base order sized to your rotation demand plus a conservative loss assumption — the low end of the confidence interval, not the midpoint — early enough that it can be wrong without consequence. Hold a supplementary order for the difference once your own autumn counts are in. The cost of the second shipment is real, but it is smaller than the cost of either carrying a year of excess inventory or running out of frames in the split window.
Three things make the second shipment cheap enough to be worth it. Standardise your specification so the supplementary order is a repeat, not a new project — same timber, same dimensions, same finish. Keep your carton specifications on file at the factory so a repeat run does not need new packaging tooling. And state your frame standard once, in writing, on the first order: Langstroth, Dadant or National, and whether the boxes are 8-frame or 10-frame. A basket or box cut for the wrong standard is the single most common cause of a shipment nobody can use.
Dead-out salvage: what you can reuse and what you cannot
The frames inside a dead colony are not automatically scrap, and the difference between salvaging and replacing is worth real money at 399 dead-outs. Sort the equipment before you order.
Reuse after cleaning: colonies that starved, that were queenless, or that drowned out in a cold snap usually leave drawn comb that is perfectly serviceable once the dead bees and debris are cleared. Boxes and floors from these colonies need little more than scraping and a check for damp.
Reuse the box, replace the comb: where the colony died with a heavy mite load and visible virus damage, the comb is often worth more as wax than as equipment. This is a judgement call and it depends on what you are willing to put back into a hive.
Do not move between apiaries: equipment from colonies that died with foulbrood symptoms should not be transferred. Movement restrictions and inspection requirements are set by state and national authorities, and they differ by country — check the rule where you operate before you relocate anything from a dead-out. A cheap frame is not worth a quarantine.
Practically, this means your order should be sized on the assumption that some fraction of dead-out frames is recoverable. Track that fraction for one season. It is the number that turns a loss percentage into an accurate order, and most operations discover it is higher than they assumed — which is exactly the kind of error that leaves a warehouse full of frames nobody needed.
Varroa is why the loss rate stays high, and it shapes the kit
NASS reports Varroa mites as the leading stressor reported by operations with five or more colonies in every quarter surveyed in 2025, with 21.8% of colonies affected in January–March 2026 and 26.3% in April–June 2026. The 2025–2026 survey and the federal count therefore point at the same driver, and that driver has equipment consequences.
Monitoring equipment is now a standing purchase rather than an optional one. Alcohol wash or sugar roll kits, CO2 testers and mite-count trays are consumed every season on every yard that samples on a schedule, and they are cheap enough that they are usually added to a container at the last minute — or forgotten. Put them on the standing order.
Floor design follows from the same problem. A screened floor with a sliding tray turns every inspection into a mite count, which is the cheapest monitoring you can buy. A solid floor is warmer and cheaper and tells you nothing. Operations that monitor on a schedule tend to specify screened floors for the hives they sample and solid floors elsewhere, and a distributor stocking only one type loses that customer.
Treatment equipment is the third line: vaporisers, acid dispensers and the consumables that go with them. These are seasonal in a way boxes are not — they are bought before the autumn treatment window in the northern hemisphere and before the equivalent autumn build-down in the southern hemisphere, and they run out in the same week every year.
What a distributor should read from the same numbers
If you import to resell rather than to run bees, the survey data is a demand forecast for your own customers, and it has three features worth pricing in.
The demand is replacement demand, and it is inelastic. A beekeeper who has lost 40% of colonies is not choosing to buy boxes. Your customer’s order is driven by mortality, not by marketing. Stock-outs in the rebuild window lose the account, not just the sale.
The peak is early in the year. A distributor whose container lands in May has missed the quarter that NASS shows carries the heaviest additions. Land in November or December and sell through the peak.
Small items sell out first. Entrance reducers, feeders, queen excluders and foundation are low-value and easy to under-order relative to boxes. A container of boxes with no foundation in it does not rebuild a colony. Look at the parts list above and order the cheap items to the same multiple as the boxes.
One more consideration for importers: woodenware and frames are bulky, and freight per unit is a large share of landed cost. Get a stated container loading quantity from the factory for every line you intend to stock, and cost your freight per unit rather than per container. A product that looks cheap FOB can be expensive landed.
Budget build-up: what the unit price is actually made of
The table below is the structure to use when you compare quotations or build a budget. No prices appear in it, because every cell that would carry a rate depends on your specification, your port, your volume and the date you ask. Fill it in from your own quotes, and treat any supplier who will not state these components separately as a supplier you cannot budget against.
| Cost component | Unit | What drives it | What to ask the supplier for |
|---|---|---|---|
| Ex-works unit price | Currency per piece | Material grade, timber species, sheet thickness, finish | Written specification with grade and dimensions; a photo is not a specification |
| Packing | Currency per carton | Carton strength, units per carton, palletisation | Units per carton, carton dimensions in cm, cartons per pallet |
| Inland haulage to port | Currency per container | Factory location, container type | Whether the quote is FOB named port, and which port |
| Ocean freight | Currency per container | Route, season, carrier, container type | Container loading quantity per item, so freight can be spread per unit |
| Insurance | % of invoice value | Incoterm, cargo type | Which Incoterms rule the quote is built on — get the rule and the edition year in writing |
| Customs duty | % of customs value | Classification of the goods, destination country | Product description detailed enough for your broker to classify; HS assignment is destination-specific and is your broker’s call, not the factory’s |
| Customs clearance and port charges | Currency per shipment | Port, broker, inspection | Commercial invoice, packing list and any timber treatment documentation required for wood packaging |
| Inland delivery | Currency per shipment | Distance, drop count | Delivery address and whether a tail-lift or forklift is needed |
| Written-off units | % of units | Transit damage, dimensional rejects | A stated tolerance on dimensions and a stated claims process |
| Landed cost per usable unit | Currency per piece | Everything above | The only number worth comparing between quotations |
Two lines in that table decide more than the rest. Container loading quantity determines your freight per unit, and the written-off units line determines whether a cheap quotation stays cheap. Ask for both before you compare anything.
What to send with the enquiry
We quote faster and more accurately when the enquiry carries the specification. Send: your frame standard and frame depth; the number of colonies you manage and the loss rate you are planning against; whether you rebuild with packages or splits; your delivery port; and the calendar date by which the goods must be in your warehouse. A supplier who quotes without asking those questions is estimating, and you will absorb the error.
Where the numbers leave room to move, use it. The survey’s own confidence interval spans 30.1% to 53.1%, and the gap between planning for the low end and planning for the high end is a meaningful share of a season’s equipment spend. Order the predictable part — comb rotation, boxes, frames — on a standing annual cycle, and keep the loss-driven part flexible.
Pollination dependence is the reason this market keeps buying regardless of price. The FAO pollination pages set out the crop-pollination context that keeps managed colony numbers commercially necessary even at high loss rates, and the USDA Agricultural Research Service publishes the underlying honey bee research that most management guidance is built on.
For the hardware itself, the parts that carry a rebuild order are the same every year: hive components and complete hive kits for the boxes and floors, Langstroth hives in bulk quantities where the order is sized to a container, 8 and 10-frame hive kits where you want the set matched rather than assembled from separate lines, and queen rearing equipment and queen cages for the requeening that follows every rebuild.